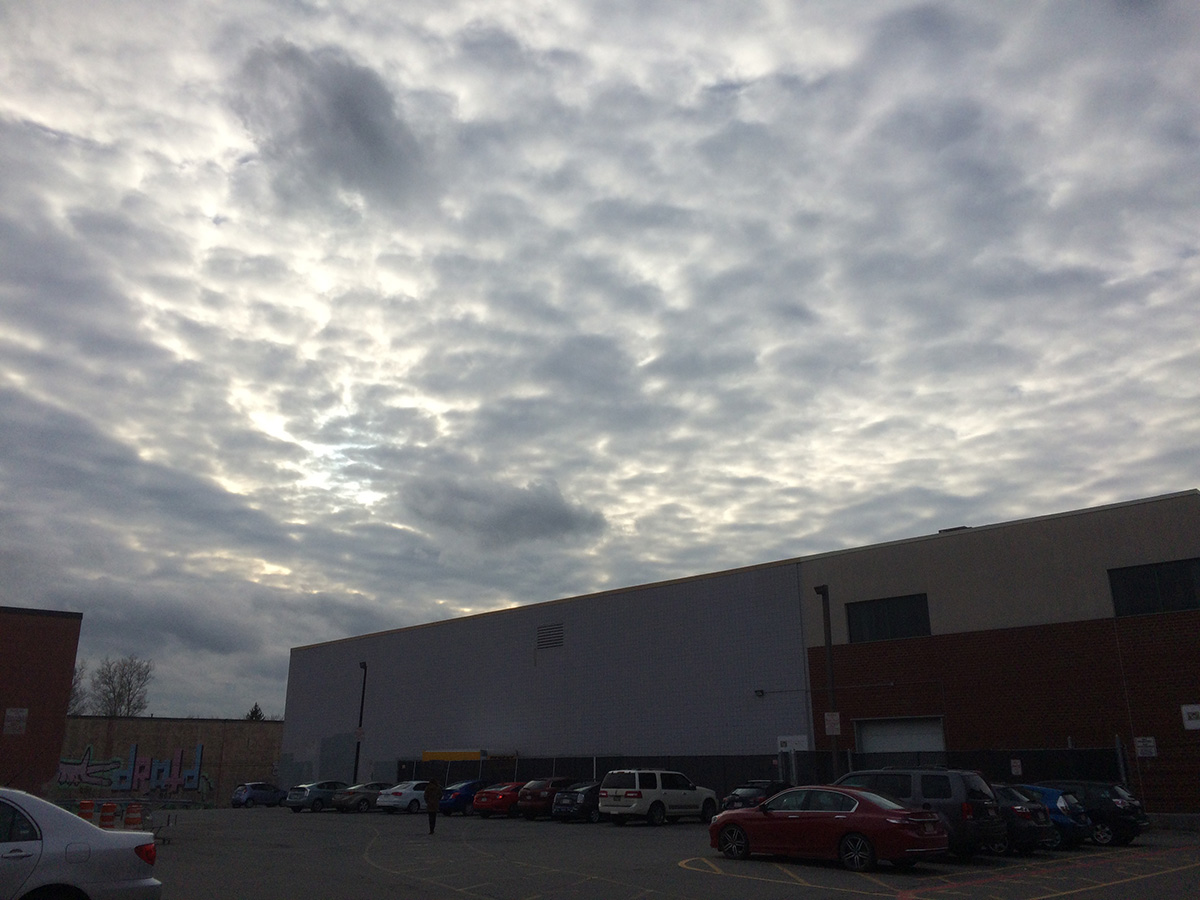
 after a fried egg english muffin sandwich for lunch, i went to michael's to pick up a skein of caron cake yarn (rainbow) before dropping it off along with another bottle of freshly squeeze orange juice for my mother at the cafe. temperature today was in the 30's, with a dense covering of clouds in the sky. it wasn't suppose to snow today but snow it did, a flash flurry in the late morning. i showed my father how to access the electricity data from belmont light's smarthub interface. afterwards i went to market basket to pick up a few grocery items, italian subs are on the dinner menu for the rest of the week.

the past 3 days have been an ugly swing of energy production. yesterday actually wasn't too bad, 26.62 kWh, but today we only managed to make half that at 13.24 kWh. tomorrow looks to be even less as another small snowstorm passes through the area, dumping snow during the daytime then transitioning to rain. there appears to be enough snow that it just simply wash away, but rather will turn to slush and freeze overnight. there could be some night time panel cleaning action if i should be in belmont tomorrow. the day after - thursday - looks to be a sunny day.
i cleaned up the exported csv from smarthub for about a month's worth of energy data, created a fancy bar graph that charts usage (electricity used from the grid), production (solar electricity returned to the grid), net (different between usage and production), and production actual (energy data pulled from the solar panels themselves). the difference between production actual and production (grid) is the amount of electricity we used during the daytime directly from the solar panels. if you added up all the exposed teal bars for this graph, you'd get about 106 kWh, which is the amount of free direct solar electricity we used that's not accounted for by the smart meter. the measured usage for the amount of days shown on the graph is 471 kWh. that meant we actually used a total of 577 kWh.
the data shows two anomalies, 1/3 and 1/9. on those two days, the smart meter recorded a higher energy production than the value given to use from the solar monitoring data. i'm going to attribute this to the early days of solar production, when the system wasn't working quite right, and the solaredge monitor might've given us the wrong values. after that, the rest of the month the data was normal.
as advertised, i made an italian sub for dinner: galbani provolone cheese melted on toasted sub bread drizzled with cider vinegar, layers of carando sweet capicola, pepper salami, and virginia ham, topped with chopped lettuce and banana peppers. the sandwich was so good in fact i might make one tomorrow morning before i'm scheduled to meet with my mother at porter square to help her score more yarn for a large blanket she's crocheting for a client (originally it was going to be knitted but that was labor intensive).
